Glass and glassware
Imports 2025 1.43 billion USD · 0.3% of imports · Chapters 70
27 6-digit HS codes in this sector. Each code has its own report: buyers or suppliers, unit price by market, companies on the same code.
VAT invoice · Bank QR payment · PDF and Excel by email
Vietnam's glass and glassware imports in 2025 were 5% below 2021
Value, billion USD; change on the year before
China took 67% of Vietnam's glass and glassware imports in 2025
Five largest suppliers, million USD, and share
Ch. 70Glass and glassware27 codes
-
 7019.11
Chopped glass strands, 50 mm or less
View report ›
-
7019.12
Glass fibre rovings
View report ›
- 7019.13 Other glass fibre yarn and slivers View report ›
- 7019.14 Mechanically bonded glass mat View report ›
- 7019.15 Chemically bonded glass mat View report ›
-
7019.61
Closed woven fabric of rovings
View report ›
-
7019.80
Glass wool and articles
View report ›
-
 7019.90
Other glass fibre articles
View report ›
-
 7007.11
Toughened glass for vehicles
View report ›
- 7007.19 Other toughened safety glass View report ›
-
 7007.21
Laminated glass for vehicles
View report ›
- 7007.29 Other laminated safety glass View report ›
-
7005.10
Float glass with absorbent layer
View report ›
-
 7005.21
Tinted float glass, surface ground
View report ›
-
7005.29
Clear float glass, non-wired
View report ›
-
 7005.30
Wired float glass
View report ›
-
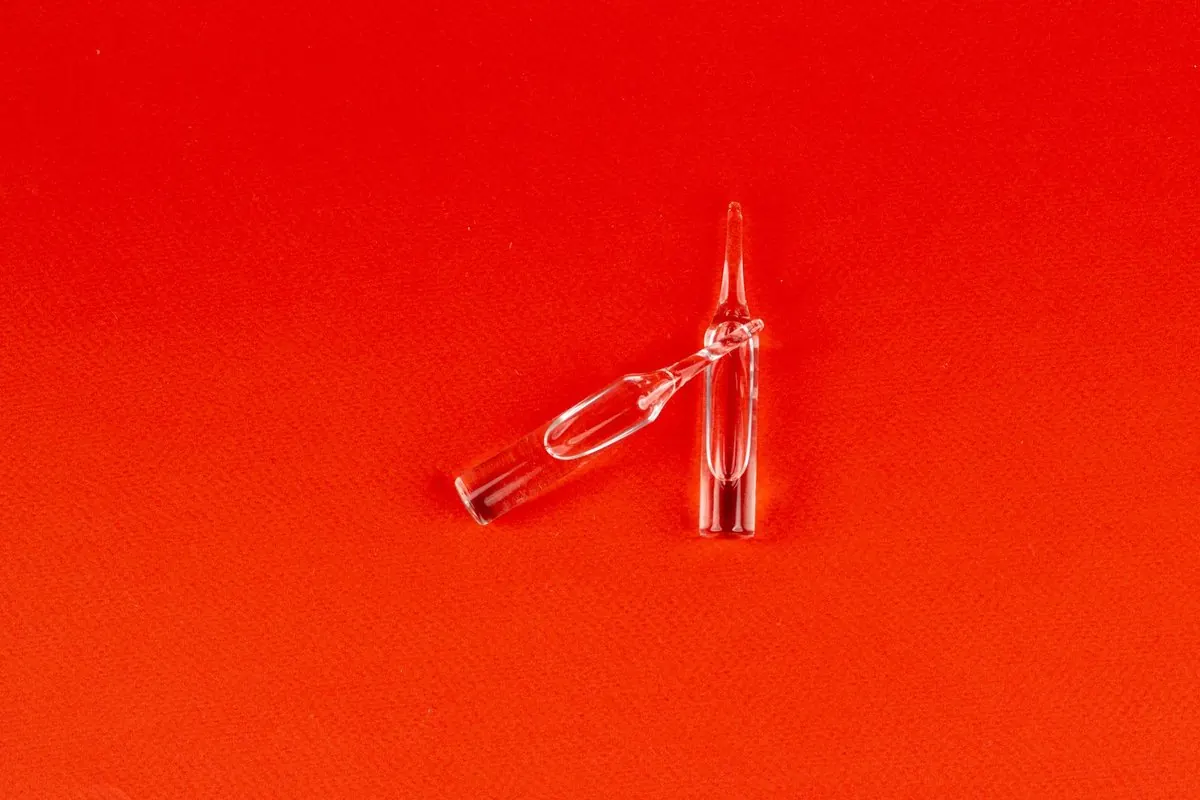 7010.10
Glass ampoules
View report ›
-
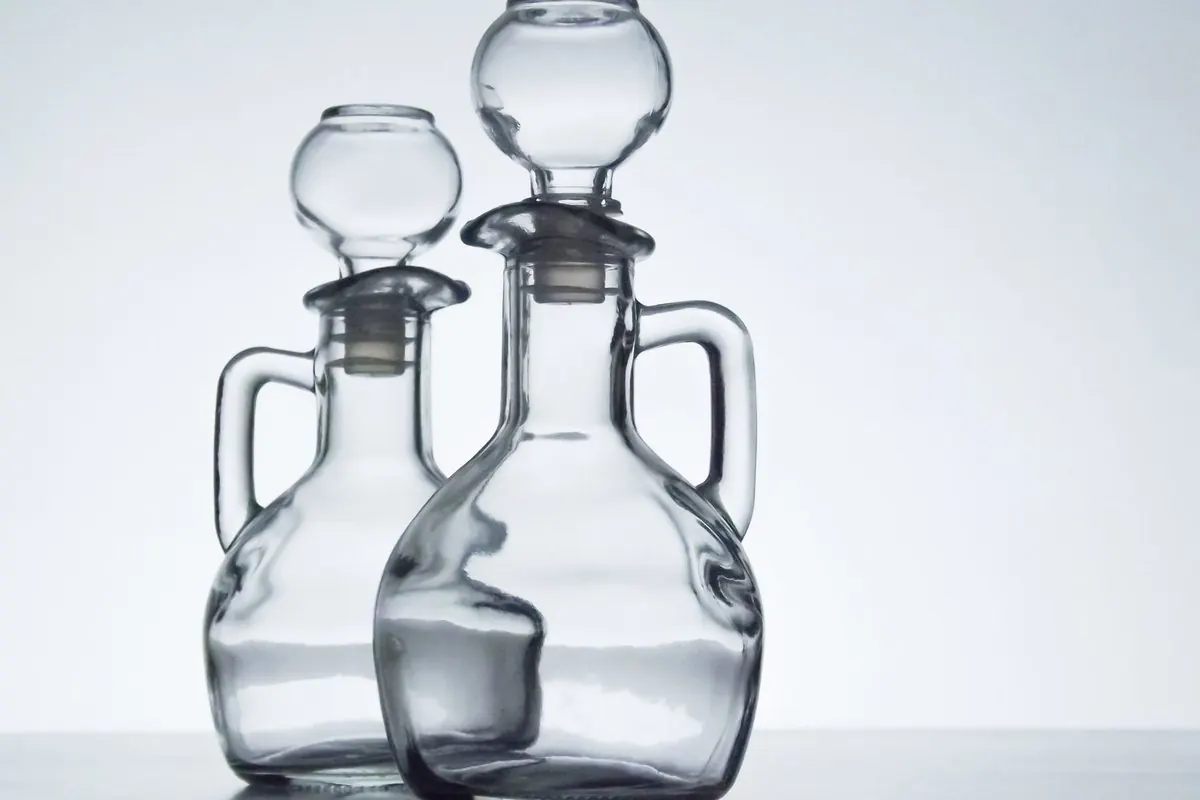 7010.20
Glass stoppers, lids and caps
View report ›
-
 7010.90
Glass bottles, jars and flasks
View report ›
-
 7013.10
Glass-ceramic ware
View report ›
-
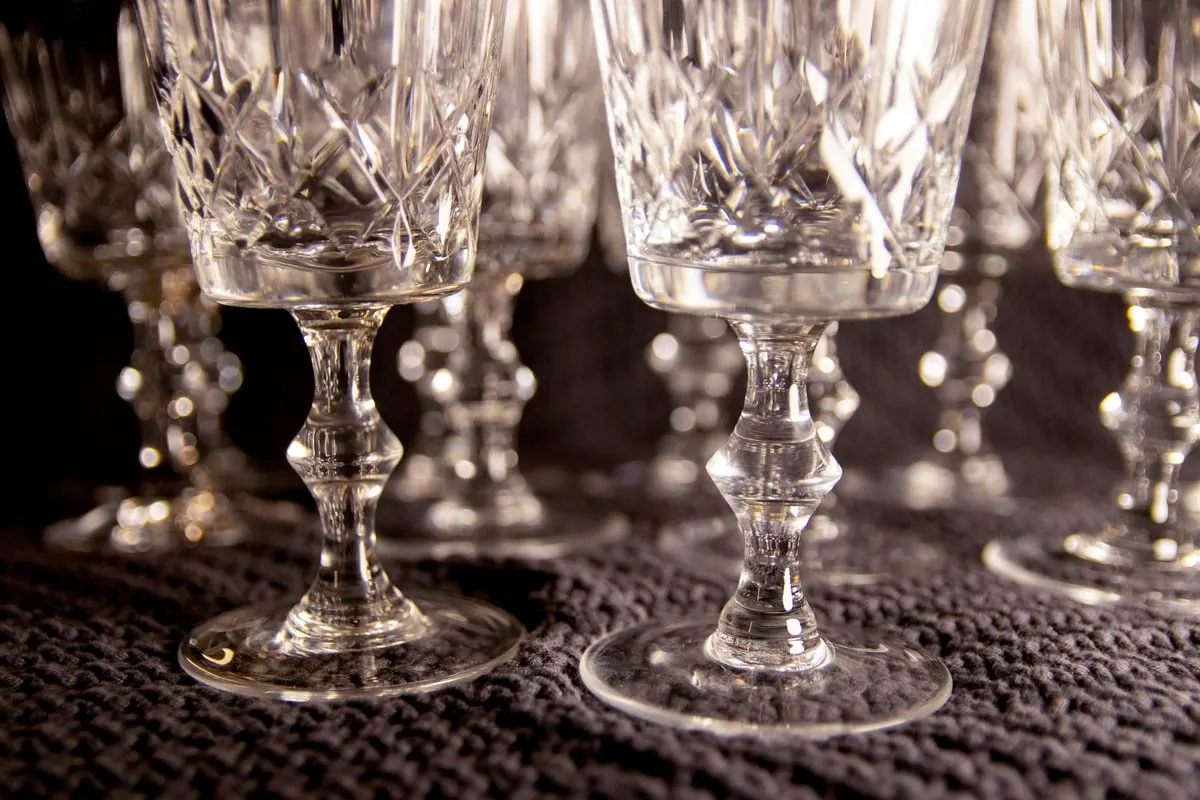 7013.22
Lead crystal stemware
View report ›
- 7013.28 Other stemware glasses View report ›
- 7013.37 Other drinking glasses View report ›
-
 7013.42
Borosilicate heat-resistant glassware
View report ›
-
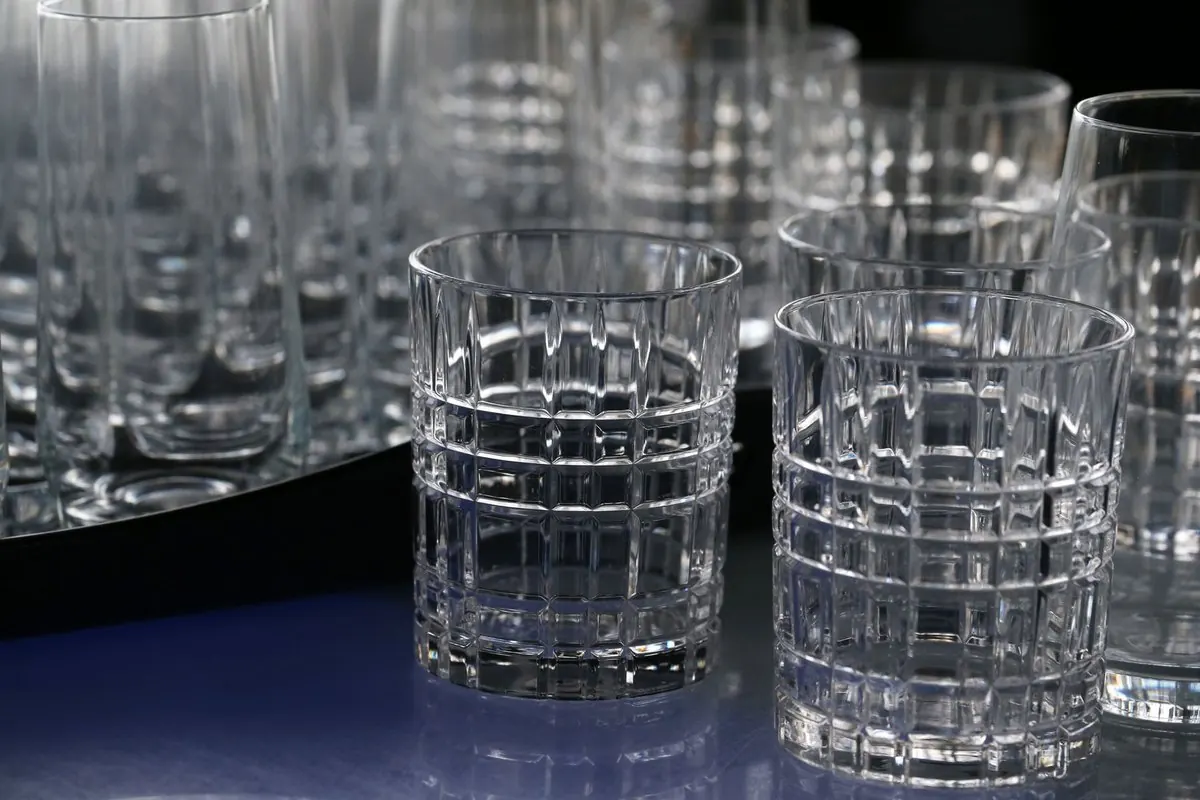 7013.49
Other glass table and kitchenware
View report ›
-
 7013.91
Lead crystal ornaments
View report ›
- 7013.99 Other decorative glassware View report ›